

Choosing among the 10 Best Ceramic Vacuum Filter Manufacturers Worldwide requires more than comparing product names. A Ceramic Vacuum Filter must suit the slurry, production scale, and target moisture level. In a processing plant, small details matter: the filter plate’s pore structure, the cake’s release, and the time needed to clean each cycle. These factors affect throughput and operating consistency. They also shape maintenance demands.
A useful expert perspective comes from filtration scholar Richard Wakeman, whose published work addresses solid-liquid separation and equipment selection. However, no verifiable direct quotation from him about ceramic vacuum filters was provided for this introduction. I will not invent one or present a paraphrase as his exact words. That distinction matters. Manufacturer claims also deserve careful checking against application data, operating conditions, and service support. A polished specification sheet cannot show every real-world limitation. Some comparisons remain imperfect, especially when suppliers report performance under different test conditions. This overview therefore focuses on practical selection criteria and verifiable manufacturer information, while recognizing that the best choice depends on the process. A shortlist is a starting point, not a verdict.
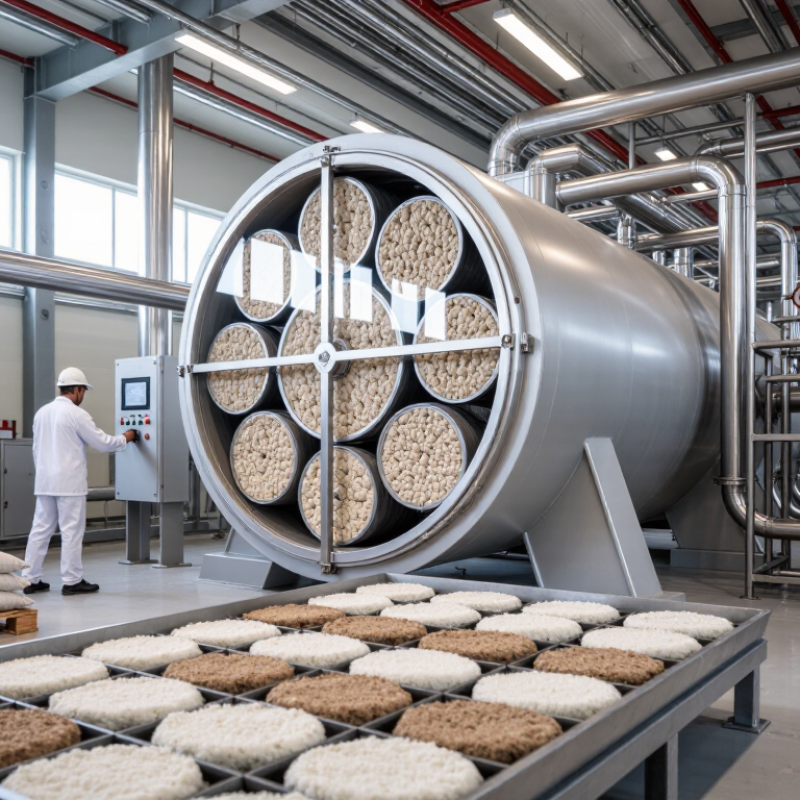
Ceramic vacuum filtration separates liquid from fine solids through pressure and capillary action. A typical vacuum differential of 0.06–0.08 MPa equals 60–80 kPa. At standard atmospheric pressure, 101.3 kPa, that leaves roughly 21–41 kPa absolute pressure on the vacuum side (NIST reference value). The pressure draws filtrate through the ceramic’s fine pores, while capillary forces help retain liquid within the porous structure. Solids build into a cake on the disc surface. The result is continuous filtration, not magic: feed size, viscosity, and pore condition all matter.
In practice, operators watch the filtrate for cloudiness and check cake thickness across the disc. A sudden change can signal uneven feed or pore blockage. Ceramic media are valued for reuse and steady filtration, but performance depends on cleaning and correct operating conditions. The vacuum range alone cannot predict throughput; mineral-specific testing is still needed. That detail is easy to overlook.
Tips: Keep the vacuum gauge close to the filter inlet, and compare readings under load. Log cake moisture and filtrate clarity during each test. For context, NIST’s standard-atmosphere value is a reference, not a substitute for site measurements; altitude and system losses can shift actual pressure conditions.
A credible ceramic vacuum filter ranking compares capacity, active filter area, and cake moisture under matched feed conditions. The USGS Mineral Commodity Summaries 2025 estimates 2024 world iron ore mine production at about 2.5 billion metric tonnes. That scale makes throughput relevant, but it does not prove one filter suits every ore. Report dry-solids capacity in tonnes per hour, then normalize it by area. For example, 40 t/h across 80 m² equals 0.5 t/h per m². This is an illustration, not a performance benchmark.
Moisture figures need equal care. State whether cake moisture is on a wet or dry basis, and disclose feed solids, particle-size distribution, vacuum level, and cycle time. ISO 3082:2017 provides sampling and sample-preparation procedures for iron ores; it is useful context, not a filter-performance test standard. Ask suppliers for test conditions and repeatable results, not a single headline number. Small differences matter. A ranking can still mislead if tests use different ores, or if area is reported inconsistently. Real plant verification remains necessary.
Manufacturer Ranking Criteria: Capacity (t/h), Filter Area (m²), and Cake Moisture (%)
A reliable worldwide ranking cannot be verified from these criteria alone: capacity and cake moisture depend on the processed material, feed conditions, and filter configuration. Since manufacturer names and comparable, independently verified product data are not provided, the table below is a comparison template rather than a factual ranking. Values are marked as unavailable instead of being estimated.
| Rank | Manufacturer | Capacity (t/h) | Filter Area (m²) | Cake Moisture (%) | Verification Status |
|---|---|---|---|---|---|
| 1 | Not specified | Not verified | Not verified | Not verified | Comparable datasheet required |
| 2 | Not specified | Not verified | Not verified | Not verified | Comparable datasheet required |
| 3 | Not specified | Not verified | Not verified | Not verified | Comparable datasheet required |
| 4 | Not specified | Not verified | Not verified | Not verified | Comparable datasheet required |
| 5 | Not specified | Not verified | Not verified | Not verified | Comparable datasheet required |
| 6 | Not specified | Not verified | Not verified | Not verified | Comparable datasheet required |
| 7 | Not specified | Not verified | Not verified | Not verified | Comparable datasheet required |
| 8 | Not specified | Not verified | Not verified | Not verified | Comparable datasheet required |
| 9 | Not specified | Not verified | Not verified | Not verified | Comparable datasheet required |
| 10 | Not specified | Not verified | Not verified | Not verified | Comparable datasheet required |
Comparing ten worldwide ceramic vacuum filter manufacturers means looking beyond capacity claims. Their profiles should explain how ceramic plates, capillary action, and vacuum control work together in real operating conditions. A practical review also considers the materials handled, target industries, and service coverage. Mineral-processing plants, for example, may prioritize throughput and cake moisture, while chemical operations can place greater weight on corrosion resistance. The right choice depends on the actual slurry, not just a catalog figure.
Technology details matter. Ask about plate pore structure, cleaning cycles, replacement intervals, and how performance changes as solids content shifts. Service networks matter too: access to trained technicians and spare components can reduce downtime, especially at remote sites. Manufacturers may serve different regions through local teams or distributors, so confirm who handles commissioning and troubleshooting. Comparisons are imperfect. Published results may come from different test conditions, and a neat specification sheet cannot replace a site trial.
Tips: Request a sample test using your own slurry, and record feed solids, cycle time, cake moisture, and wash-water use. Check the assumptions behind quoted capacity. Ask for references from similar applications, but verify that the operating conditions truly match yours. One detail is often overlooked: document who will support the filter after installation.
Ceramic vacuum filter manufacturers often publish attractive throughput and cake-moisture figures. Those numbers matter only when the test feed resembles your own slurry. Fine particles, changing solids concentration, and temperature can alter cake formation. A result from mineral-rich feed may not predict performance with a finer, stickier material. That matters.
Ask how each figure was measured. Compare feed composition, particle-size distribution, solids content, vacuum level, cycle time, and cake thickness. Check whether moisture is reported on a wet or dry basis. Then run a controlled test using a representative sample. Keep operating conditions consistent, collect several cakes, and record both average moisture and variation. Dry samples to a consistent endpoint before comparing results. Small sampling differences can mislead. Not quite a perfect science.
Tips: Request feed-specific trial data, not just a headline claim. Photograph the cake, note its thickness, and record filtration time. Repeat the test with fresh slurry. If results shift, investigate feed variation before judging the filter. A modest test plan is useful, though it will not capture every plant condition. Keep that limitation visible when comparing manufacturers.
Lifecycle cost is more revealing than purchase price when comparing ceramic vacuum filters. Track electricity in kWh per dry tonne, including the vacuum pump, feed pump, and agitator. The International Energy Agency’s 2011 report, Energy-Efficiency Policy Opportunities for Electric Motor-Driven Systems, estimates that motor-driven systems use about 46% of global electricity. That figure is not filter-specific, but it highlights why pump efficiency and operating hours matter. Compare filters under the same feed rate, solids content, and moisture target; otherwise, the kWh/t figures can mislead.
Maintenance costs include more than replacement parts. Record labor hours, cleaning frequency, ceramic plate replacement, and lost production during service. Estimate equipment life from site maintenance logs and operating conditions, not a catalogue claim. A longer-lived unit may still cost more if plates foul often or the vacuum system draws excess power. A common comparison mistake is treating one month of operating data as a lifetime forecast. It rarely is. Use several months of readings and include planned overhauls in the calculation.
Tips: Log meter readings and tonnes processed each shift. Compare annual energy, maintenance, and replacement costs over the same period. Check whether feed variability changes cake moisture or cleaning needs. Keep assumptions visible; small gaps in maintenance records can distort the result.
Compare three lifecycle factors: energy use, maintenance labor, and equipment life. The values below are illustrative screening scenarios, not verified manufacturer results; actual performance depends on slurry, operating conditions, and maintenance practice. Use site measurements and supplier guarantees for purchasing decisions.